Brand:
GESTERItem NO.:
GT-A14EOrder(MOQ):
1Lead Time:
20-30 daysProduct Detail
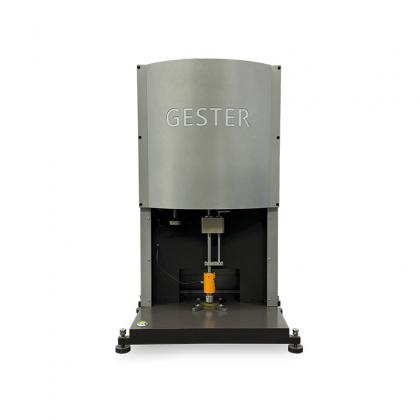
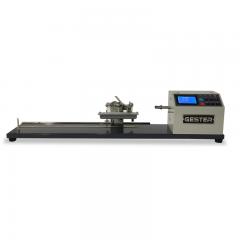
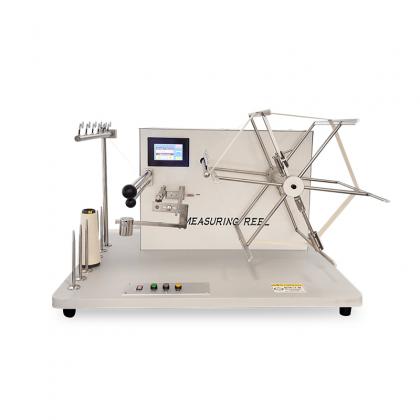
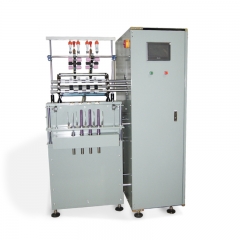
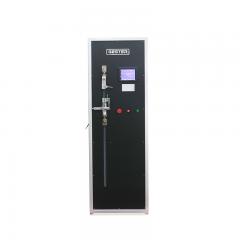
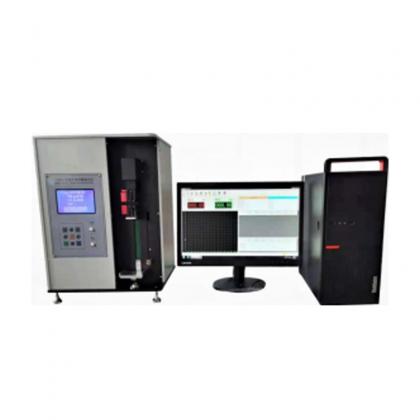
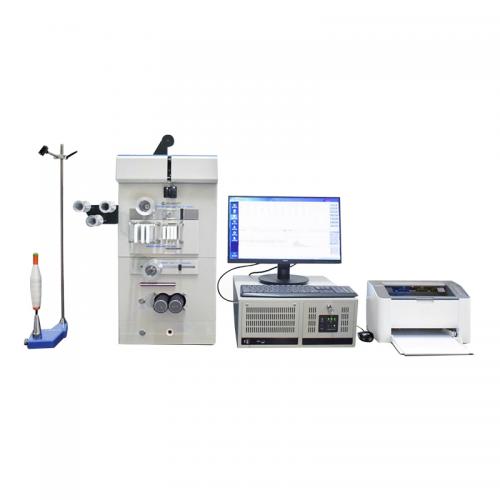
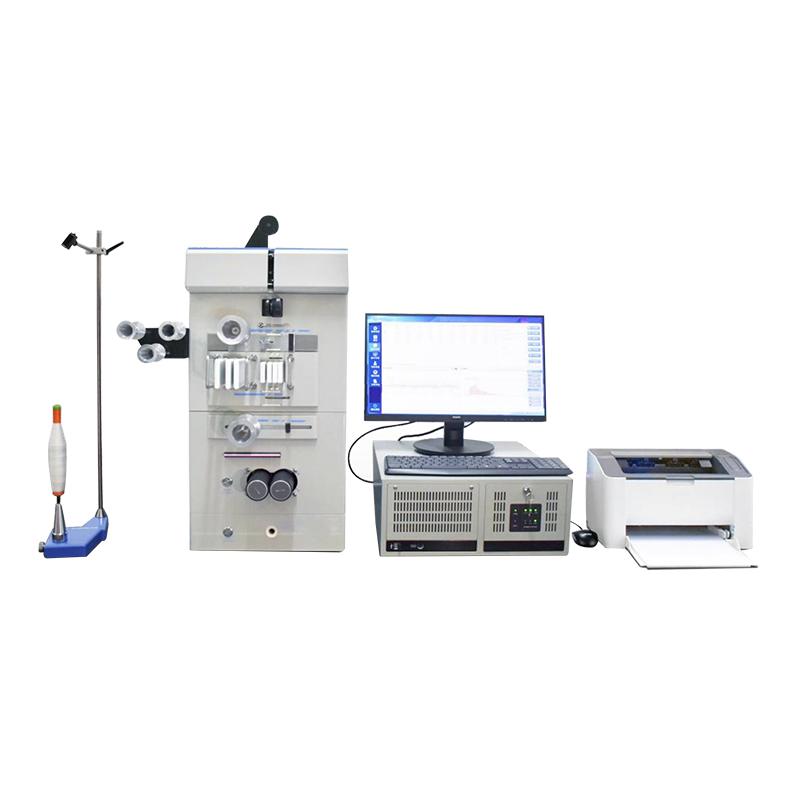
Yarn and Sliver Evenness Tester GT-A14E
Yarn and Sliver Evenness Tester is a universal high-performance textile testing instrument, which is used to test the yarn unevenness. It is applicable to pure and blended slivers of cotton, wool, silk, linen and chemical staple fibers, and is of great significance for improving and ensuring yarn quality.
|
Model |
GT-A14E |
|
Capacitive measuring cells |
5 pcs |
|
Measurement range |
4tex-80ktex |
|
Drafting speed |
4、8、25、50、100、200、400m/min |
|
Testing time |
At intervals of 10 seconds, choose any time within 10 seconds to 20 minutes |
|
CV% measuring range |
0.2% ~ 99.99% |
|
Variation - length curve cutting length |
1cm~983cm |
|
Deviation rate (DR%) and DR curve |
DR measuring range 0.01% ~ 99.99% |
|
Reference lengths and thresholds |
20cm,+35%; 20cm,-30%; 1m,5%; 1m,-5%; |
|
DR curve |
Positive and negative deviation rate curves with reference lengths of 1 cm, 10 cm, 20 cm, 50 cm, 1 m, thresholds from 0% to 50% |
|
Imperfection values: Simultaneous output of imperfection values at 12 sensitivity levels |
Thin : -30%, -40%, -50%, -60% |
|
Thick: +35%, +50%, +70%, +100% |
|
|
Neps : +140%, +200%, +280%, +400% |
|
|
Spectral analysis range |
Normal spectrogram: 1 cm ~ 2937 m (85 channels) |
|
High-resolution spectrogram: 1 cm ~ 2937 m (340 channels) |
|
|
Linear density frequency distribution range |
2 diagrams covering -100% ~ +100% and above +100% |
|
Two statistical functions |
Statistical analysis of test data, including mean, between-package CV (Cvb), 95% confidence interval (Q95%), maximum, minimum, etc. |
|
Graphical statistics of batch spectrograms and variation-length curves |
|
|
Statistical distribution diagrams |
Statistical distribution diagrams for common test indicators (CV%, thin places -50%, thick places +50%, neps +200%), statistical time arbitrarily settable on a daily basis |
|
Power supply |
1 phase AC 220V±10%, 50Hz/60Hz |


Friendly Links :
 English